Benchmark run
Crispasr vs whisper
to test which asr harnes is best.
Aug 17, 2026
- Models
- 6
- Samples per dataset
- 20
- Warmup runs
- 3
- Hardware
- Apple M4 Max / 36 GB / macOS 26.5.1
Full results
Accuracy is the share of words transcribed correctly per language condition, so higher is better; speed is milliseconds per second of audio, so lower is better. The best value in each column is emphasised, and a cell reading a dash says on hover why there is no figure in it.
Accuracy (%) per language, and speed in ms per second of audio, so lower is better. A cell reading a dash was never measured, and hovering any cell says what is behind it.
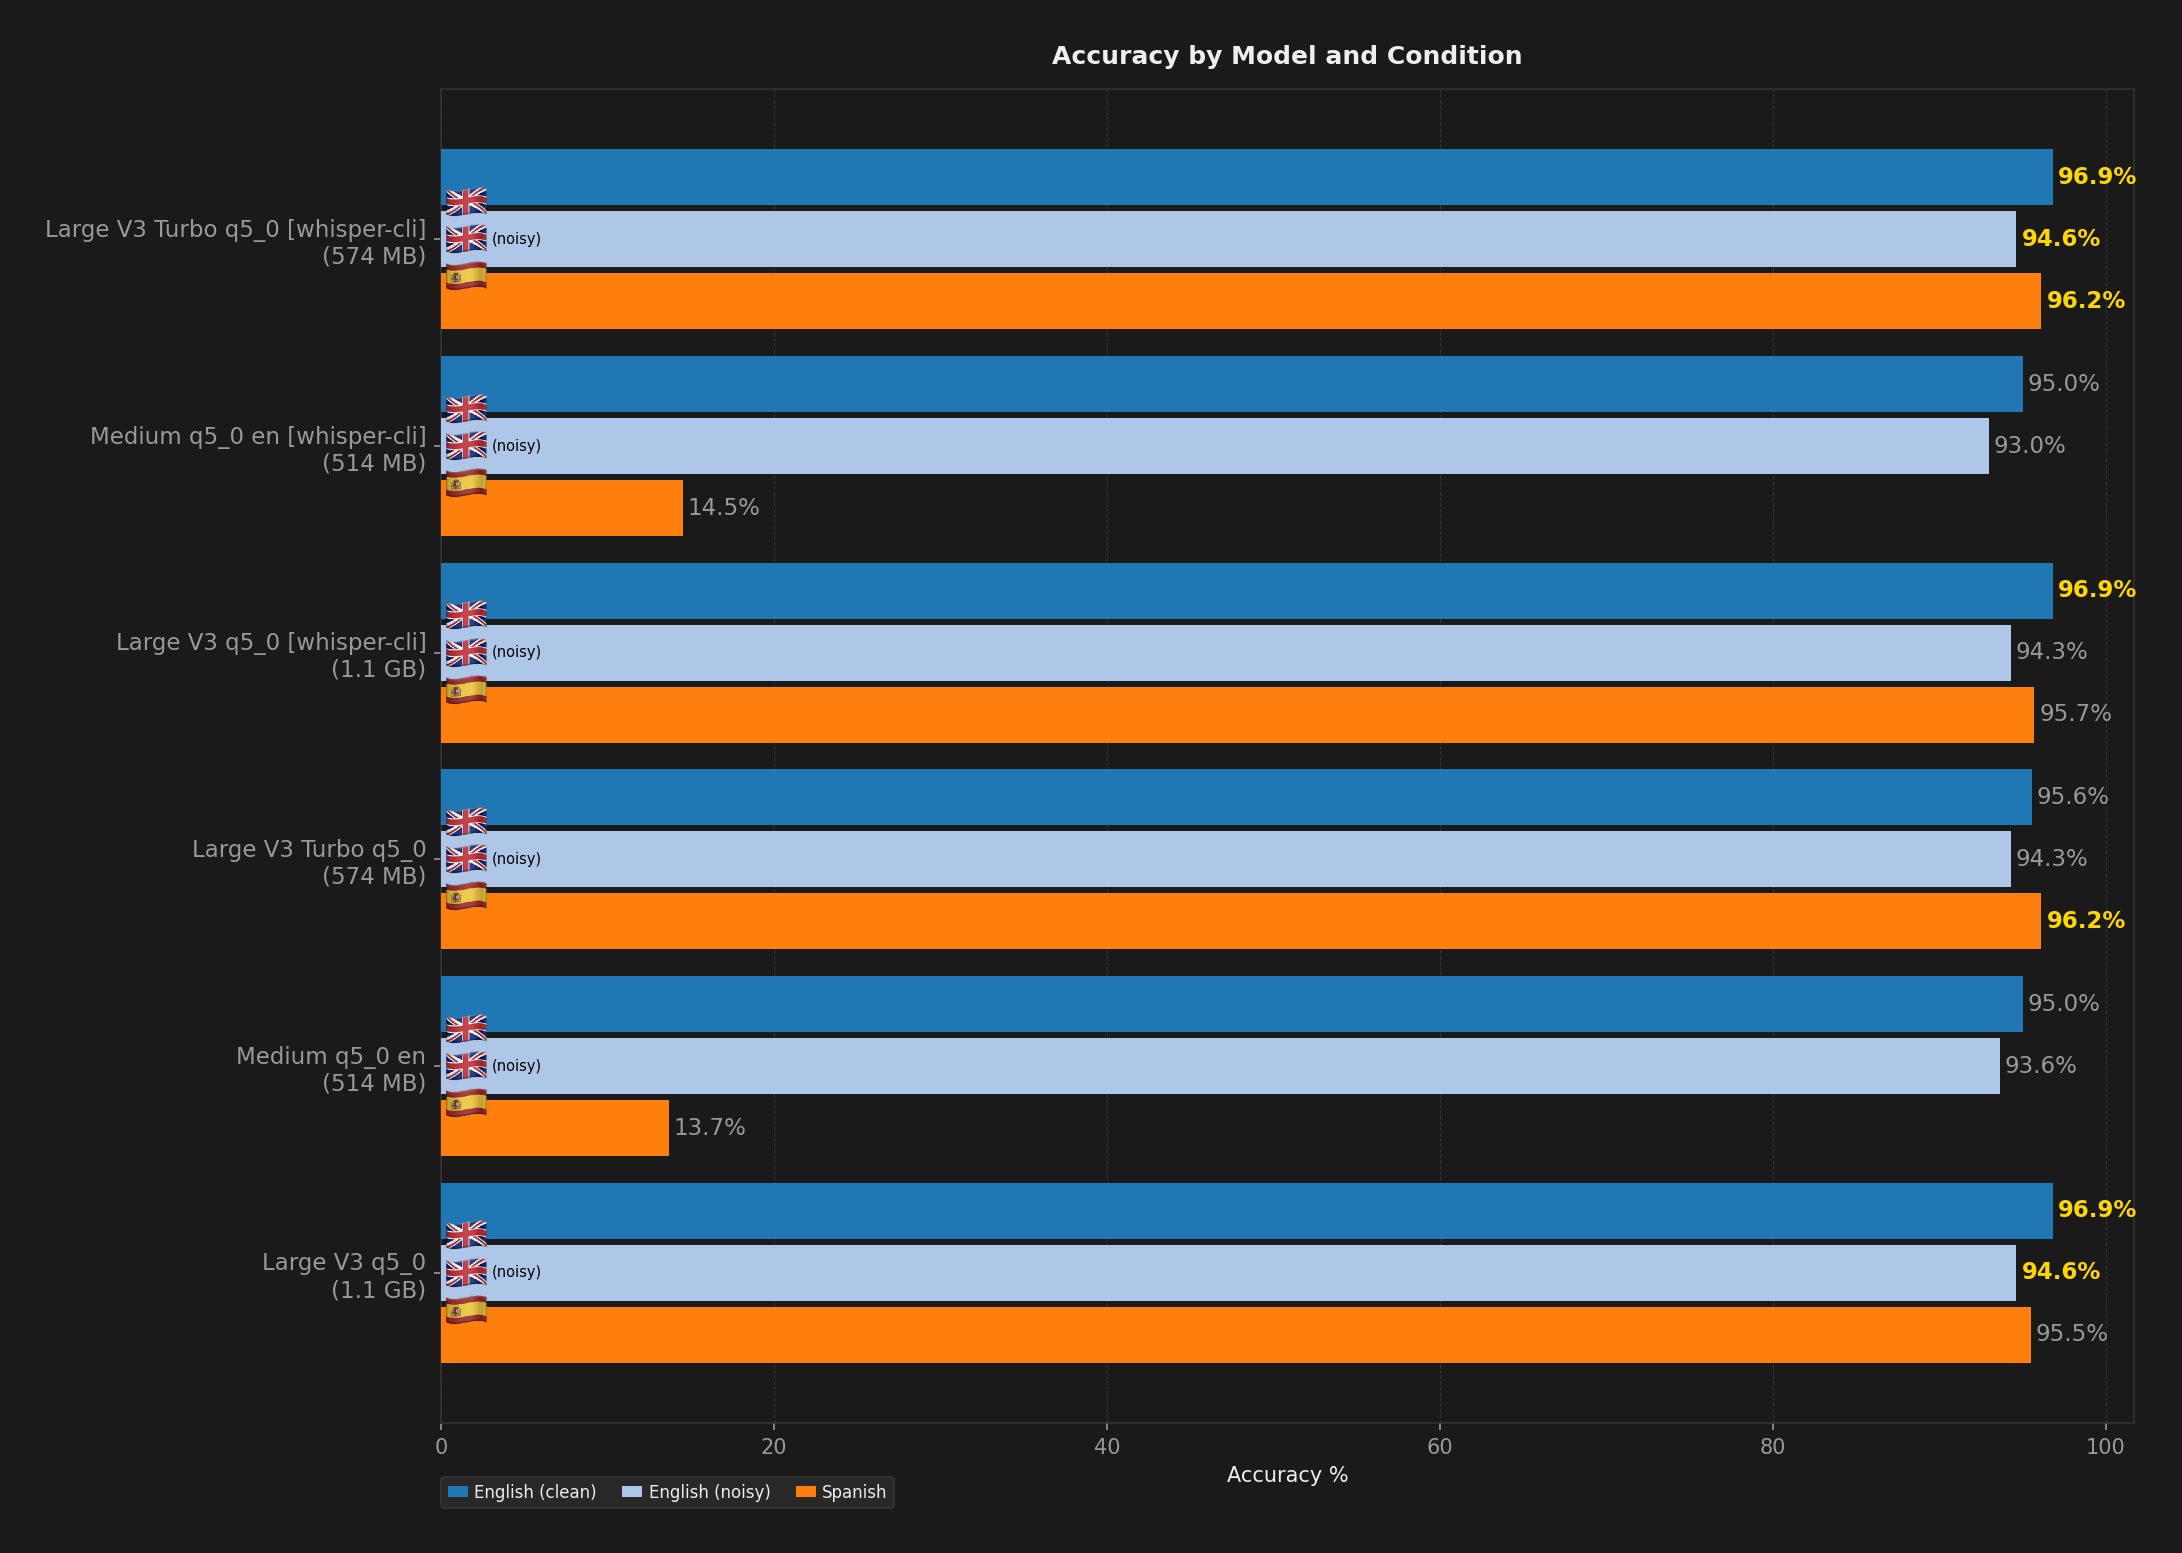
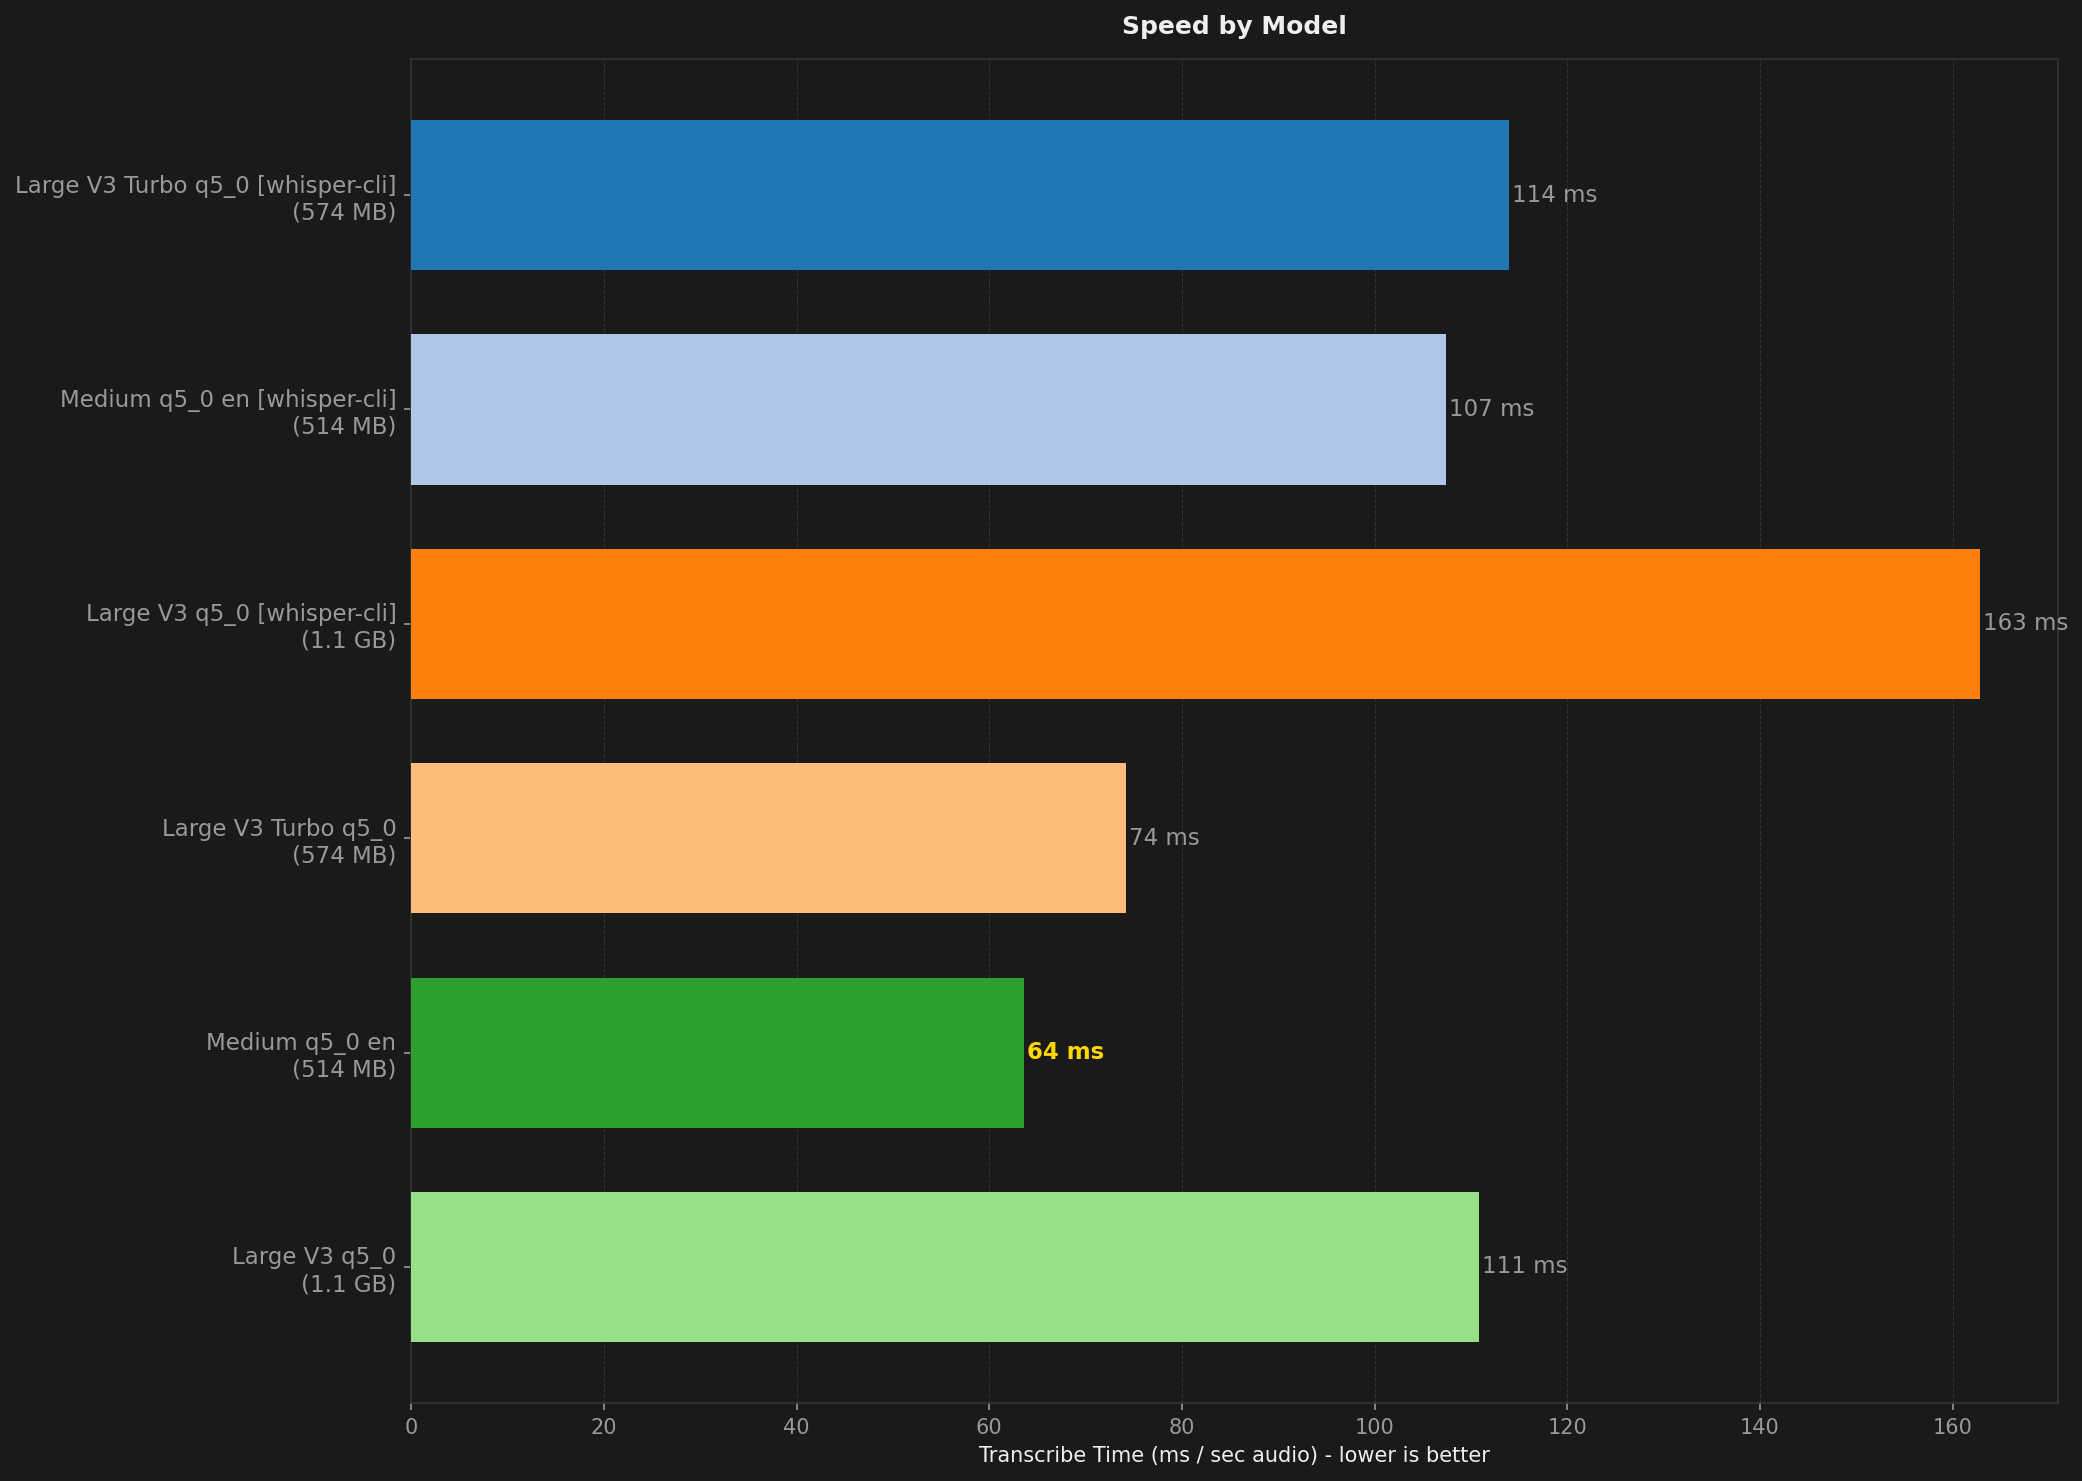
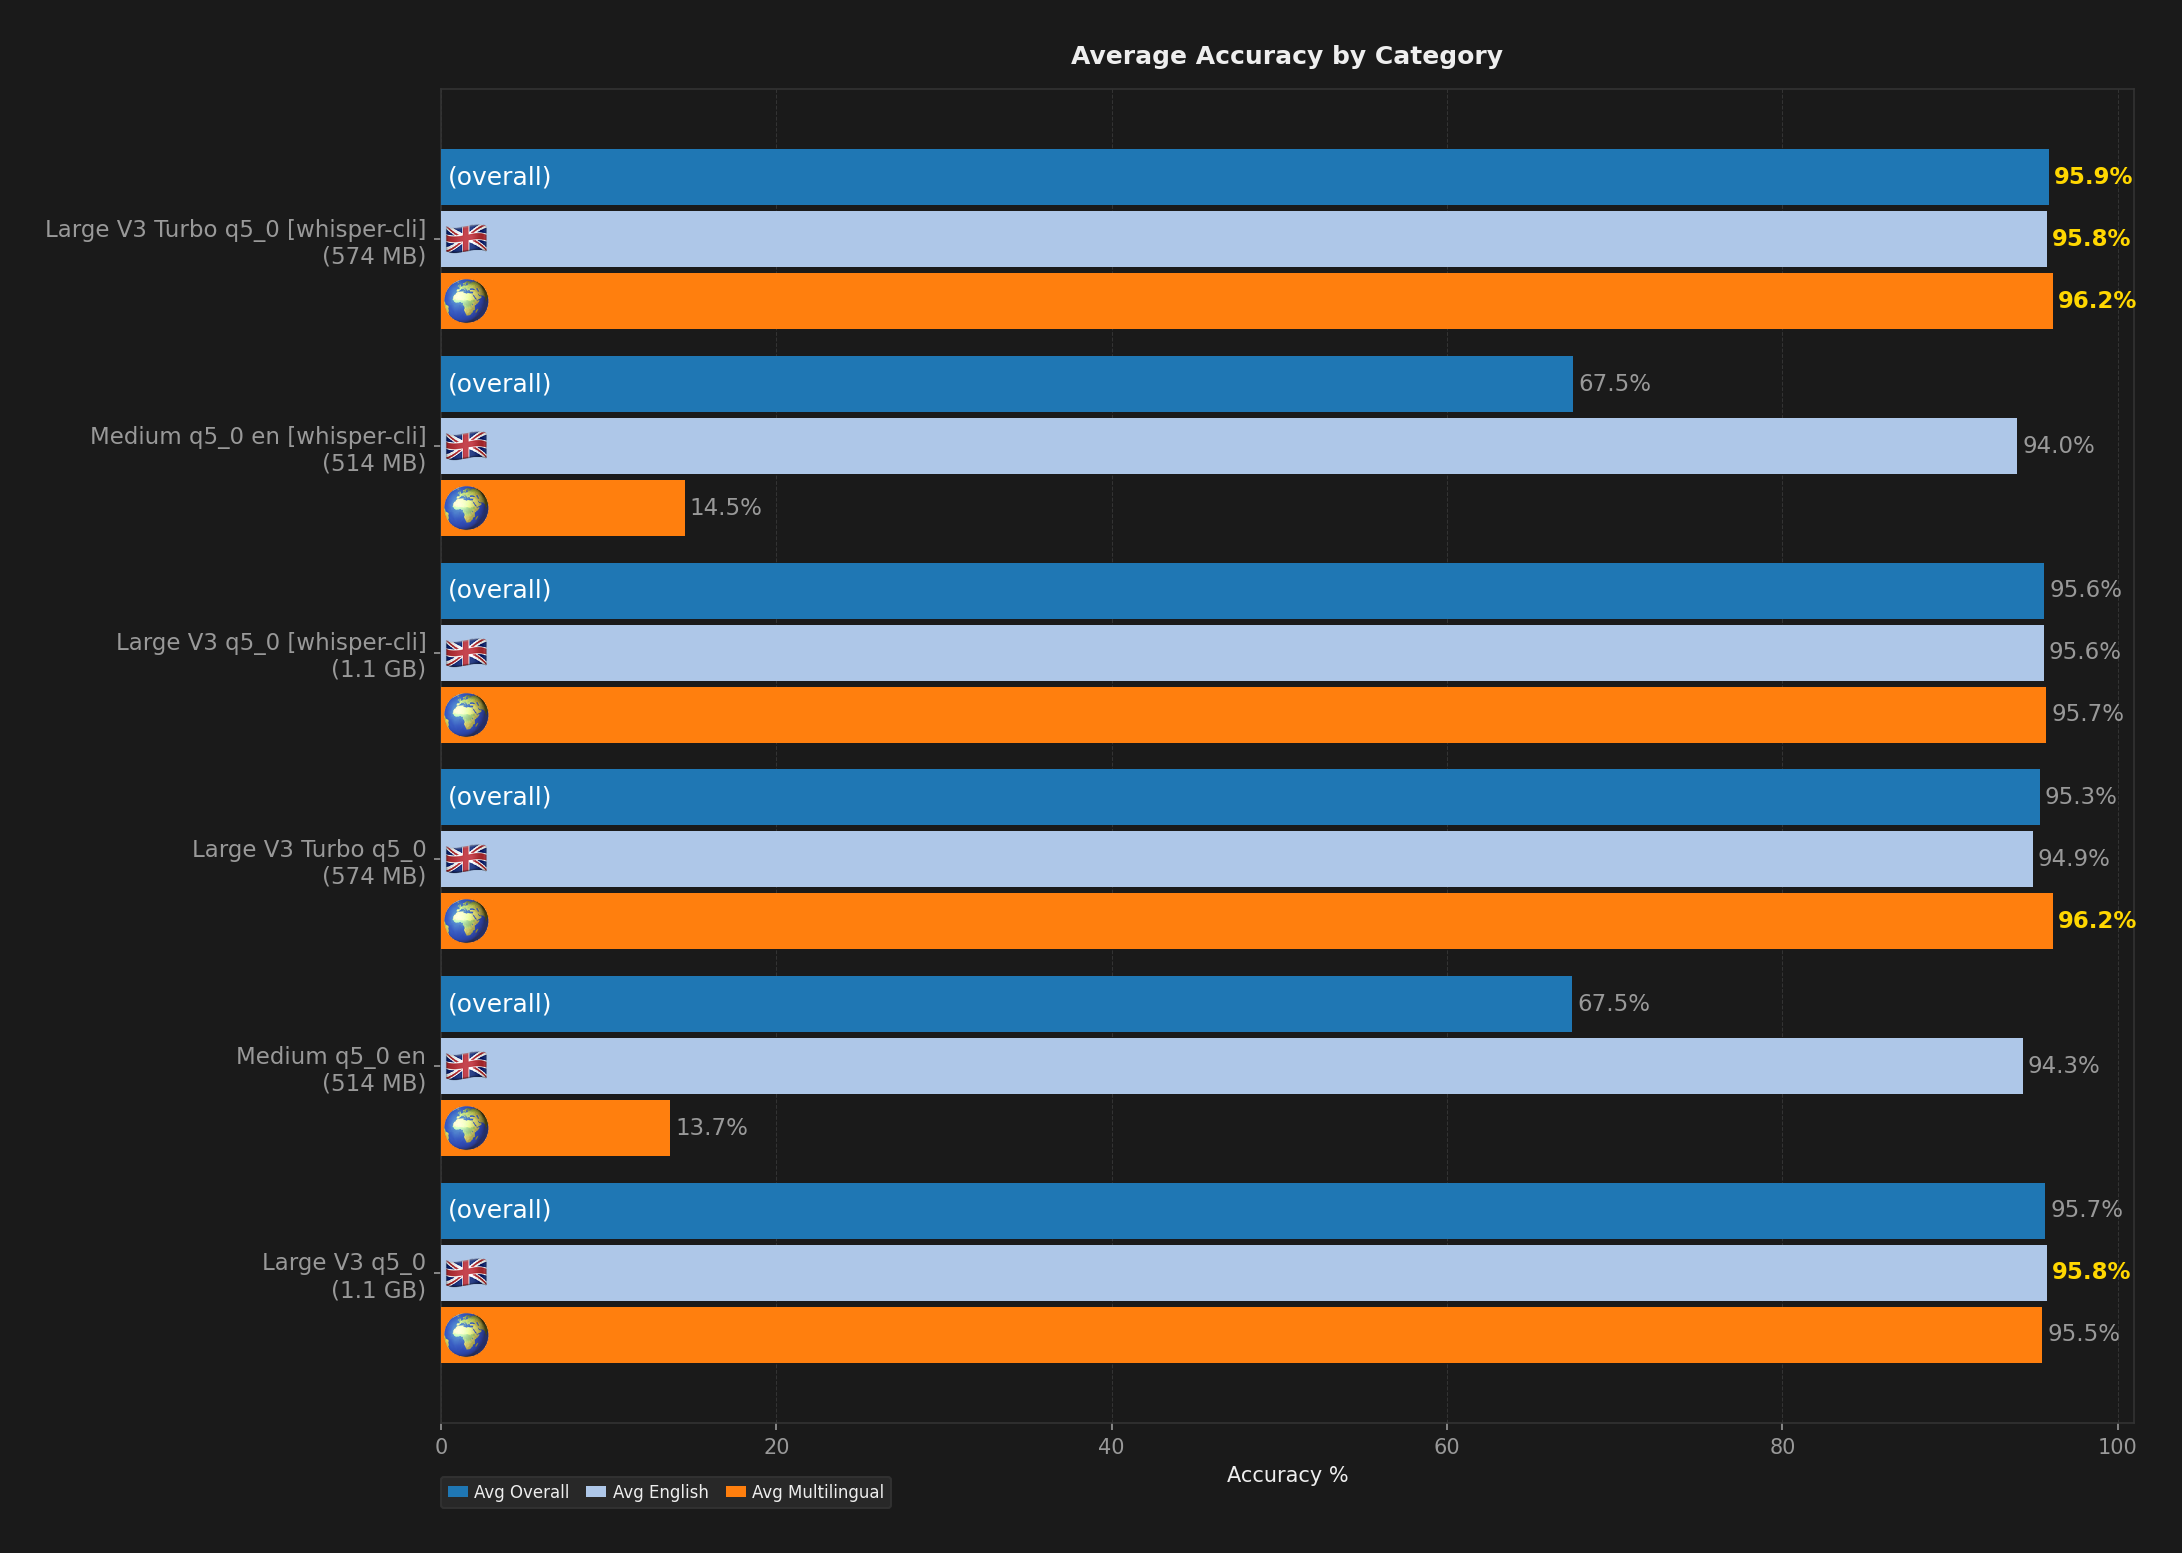
| Whisper Large V3 Turbo Q5_0 (whisper-cli) | 17 | 574 MB | 801 MB | 108 ms | 96.0%Every word from every language counted together, not an average of per-language scores. | 95.9%Every word from every language counted together, not an average of per-language scores. | 96.2%Every word from every language counted together, not an average of per-language scores. | 96.9% | 94.6% | 96.2% |
|---|---|---|---|---|---|---|---|---|---|---|
| Whisper Large V3 Q5_0 (whisper-cli) | 17 | 1.1 GB | 2.0 GB | 154 ms | 95.7%Every word from every language counted together, not an average of per-language scores. | 95.7%Every word from every language counted together, not an average of per-language scores. | 95.7%Every word from every language counted together, not an average of per-language scores. | 96.9% | 94.3% | 95.7% |
| Whisper Large V3 Q5_0 | 17 | 1.1 GB | 1.5 GB | 104 ms | 95.7%Every word from every language counted together, not an average of per-language scores. | 95.9%Every word from every language counted together, not an average of per-language scores. | 95.5%Every word from every language counted together, not an average of per-language scores. | 96.9% | 94.6% | 95.5% |
| Whisper Large V3 Turbo Q5_0 | 17 | 574 MB | 738 MB | 69 ms | 95.5%Every word from every language counted together, not an average of per-language scores. | 95.0%Every word from every language counted together, not an average of per-language scores. | 96.2%Every word from every language counted together, not an average of per-language scores. | 95.6% | 94.3% | 96.2% |
| Whisper Medium Q5_0 en (whisper-cli) | 17 | 514 MB | 1.1 GB | 99 ms | 61.7%Every word from every language counted together, not an average of per-language scores. | 94.1%Every word from every language counted together, not an average of per-language scores. | 14.5%Every word from every language counted together, not an average of per-language scores. | 95.0% | 93.0% | 14.5% |
| Whisper Medium Q5_0 en | 17 | 514 MB | 832 MB | 60 ms | 61.6%Every word from every language counted together, not an average of per-language scores. | 94.4%Every word from every language counted together, not an average of per-language scores. | 13.7%Every word from every language counted together, not an average of per-language scores. | 95.0% | 93.6% | 13.7% |
At a glance
Ratings computed from benchmark data, scaled 1 to 10, and written with their scale in every cell. Accuracy is based on Word Error Rate (WER) and does not include punctuation yet.
Ratings run 1 to 10, higher is better. A cell reading a dash was never measured, and hovering any cell says what is behind it.
| Whisper Large V3 Turbo Q5_0 (whisper-cli) | All languages | No | 7/10 | 10/10Every word from every language counted together, not an average of per-language scores. |
|---|---|---|---|---|
| Whisper Large V3 Turbo Q5_0 | All languages | No | 8/10 | 10/10Every word from every language counted together, not an average of per-language scores. |
| Whisper Large V3 Q5_0 (whisper-cli) | All languages | Yes | 6/10 | 10/10Every word from every language counted together, not an average of per-language scores. |
| Whisper Large V3 Q5_0 | All languages | Yes | 7/10 | 10/10Every word from every language counted together, not an average of per-language scores. |
| Whisper Medium Q5_0 en | English only | No | 8/10 | 3/10Every word from every language counted together, not an average of per-language scores. |
| Whisper Medium Q5_0 en (whisper-cli) | English only | No | 7/10 | 3/10Every word from every language counted together, not an average of per-language scores. |
Charts
The plots generated alongside this run. Select a chart to open it full size.